One Year of Solar Electric production for 2003
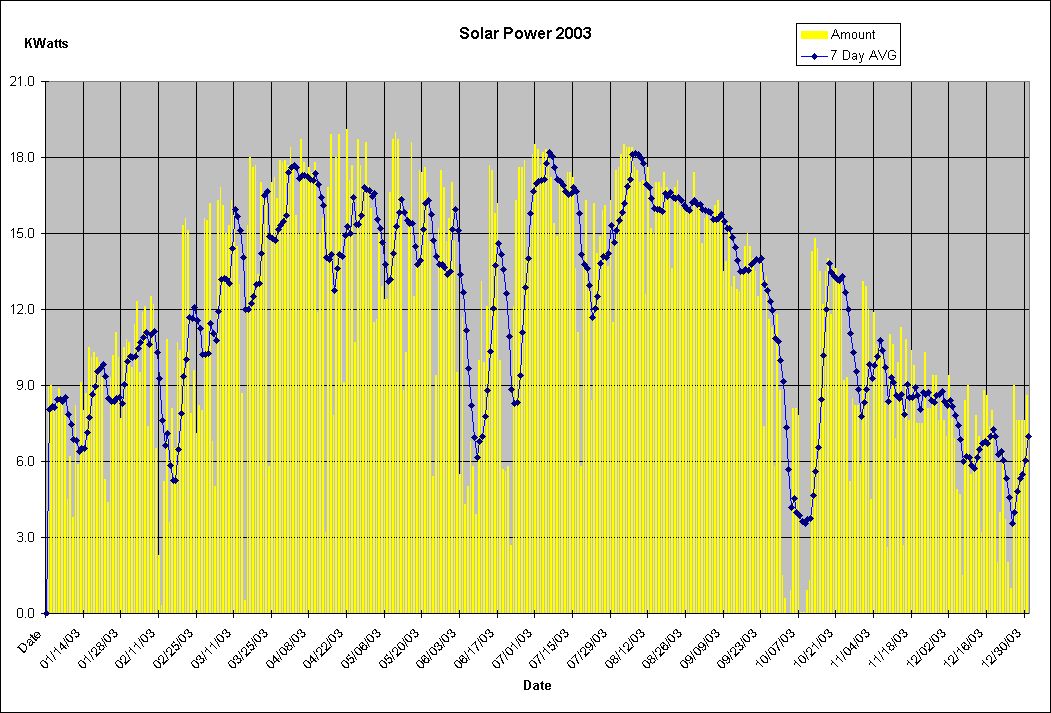
The top chart is daily production with a running 7 day average

You can easily tell which days were bright and sunny from the rainy or cloudy days
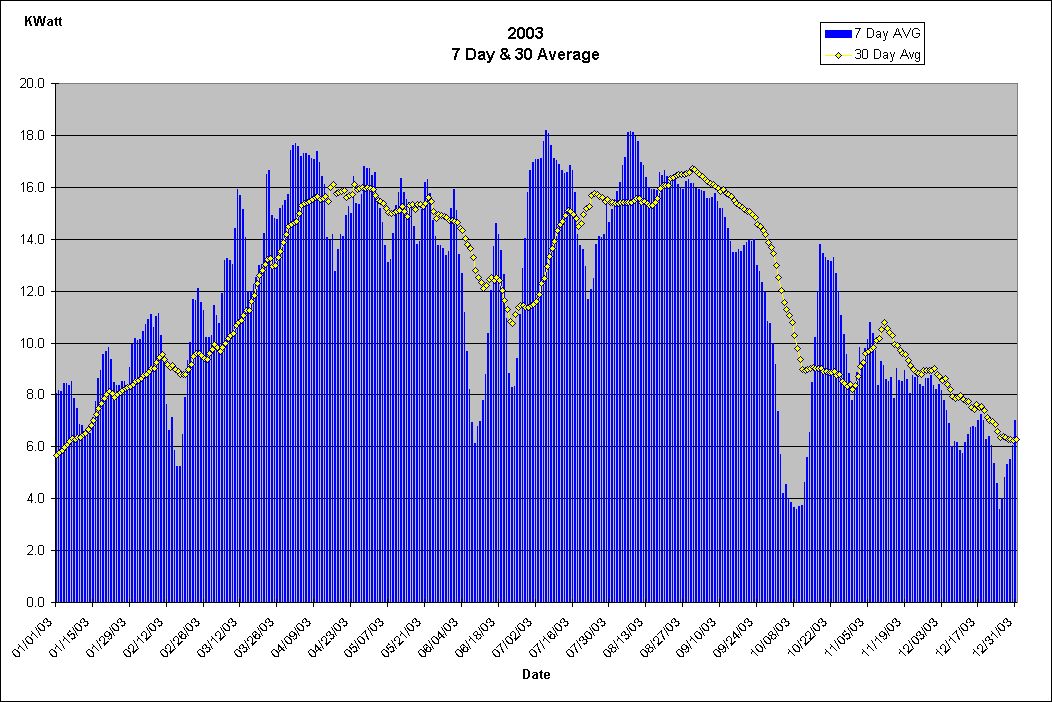
This chart is the same 7 day average in blue with a 30 day average in yellow

The big drop in October was a 2 week partial loss due to roof repair.
Last updated on 05/07/2011